National Income Statistics
An economy is normally considered to be doing well if its output is growing at a sustained and sustainable rate. This has the potential to increase people’s living standards. If it is growing at a slower rate than it is capable of, the government is likely to introduce policy measures to try and stimulate it.
We use national income statistics to compare the economic performance of different countries and to give perspective to key economic indicators.
Gross domestic product (“GDP”) and gross national product (“GNP”) / gross national income (“GNI”)
GDP is the most common measure of national income. It is a measure of the total output by the factors of production within a specific country, calculated by summing consumer’s spending, government expenditure on goods and services, total investment, changes in stocks and the difference between exports and imports.
Various other measures are derived from GDP. Adding net property income from abroad to GDP gives GNI, which used to be called GNI. This is income that domestic residents earn from physical assets and financial assets overseas, minus the amounts received by foreigners holding domestic assets. So effectively GNI is a measure of the total output produced by a country’s citizens regardless of where they produce it.
Measuring GDP
We have three main ways to calculate GDP – each should give the same total as, if we assume that all income is utilised, then expenditure should equal income:
- Output measure: Measures the value of output produced in each industry (e.g. manufacturing, construction, agriculture, hotel and catering etc.). Care is taken to avoid double-counting. So if a a tyre maker sells tyres to a car manufacturer and then the car manufacturer sells the car to a consumer, the amounts received relevant to the tyre should not be counted twice. The value added by producers is the difference between the sales revenue received and the cost of the raw materials used. e.g. a TV manufacturer who buys components for $280,000 and sells televisions with a total value of $350,000 has added $70,000 in value and this is included in the output measure.
- Income method: The value of ouput produced is assessed based on the costs of producing it, including wages, rent, interest and profits. Costs should only be included that relate to the provision of a goods or service, so transfer payments (transfer of income from taxpayers to groups or individuals as welfare payments) are not included.
- Expenditure method: Anything produced during a year will either be sold or added to inventories (i.e. stored). So adding additions to inventories to expenditure on goods and services gives an alternate measure. It is necessary to include expenditure on exports and exclude expenditure on imports, as exports contribute to a country’s output and create income in the country, whereas imports don’t. Indirect taxes should be deducted and subsidies should be added back.
Money and real GDP
Money GDP (or nominal GDP) measures GDP at the prices operating in the year the output is produced. It is not adjusted for inflation. It can give a misleading impression, as it may increase not due to greater production, but simply due to increased prices. Hence real GDP is calculated by economists, whereby GDP is measured at a fixed price (i.e. from a selected year) to remove the distorting effects of inflation. It is calculated using the following formula:
Real GDP = (money GDP) x (price index in base year) / (price index in current year)
e.g. If in 2016 money GDP is $800b and price index is 100, then in 2017 money GDP is $900b and price index is 120, then real GDP = 900x(100/120) = $750b.
The price index used for this conversion, called the GDP deflator, measures the products produced in a country (not the products consumed, like the CPI). So it includes prices of capital goods, includes price of exports, but excludes price of imports.
Task – Real GDP
In 2016 a country’s GDP is $1,000. In 2017 nominal GDP rises to $1,092 and the price index increases by 4%. Calculate:
- Real GDP;
- Percentage increase in real GDP.
Comparison of economic growth performance over time and between countries
Economic growth rates are calculated based on changes in real GDP.
When we compare economic growth rates over time and between countries, we must be careful. Official GDP figures may understate the true change in output, due to a “shadow economy”. This refers to people who don’t declare their income to the government, either to avoid paying tax, or because they are involved in illegal activities such as smuggling. The size of the shadow economy can be estimated by measuring the difference between the GDP measured by income and expenditure methods (as people will still spend income that they haven’t declared). The shadow economy is affected by factors such as the marginal rate of taxation, the penalties imposed for illegal activities and tax evasion, this risk of being caught, and social attitudes towards illegal activities.
Some countries may also find it difficult to produce accurate GDP figures. If levels of illiteracy are high in a country, some people may be unable to complete and accurately submit tax forms, so to some extent the GDP will be estimated. Estimates must also be made for non-marketed goods and services (i.e. those that are not traded, such as goods people produce for themselves, e.g. DIY work done on a house, and voluntary work).
When analysing economic growth it is also important to consider how sustainable it is.
Task: Economic Growth Rate
China’s economic growth rate fell from 7.8% in 2012 to 7.5% in 2013. The economy’s domestic demand would have supported a 9% growth rate, largely driven by investment. Weak exports due to the strength of the currency reduced the growth rate.
- What is meant by a fall in a country’s economic growth rate?
- Explain how investment can promote economic growth.
- Discuss whether a high exchange rate will reduce a country’s economic growth rate.
Comparison of living standards over time
Real GDP per head has traditionally been one of the main indicators of living standards. If it increases, we generally expect that the inhabitants of the country are enjoying higher living standards.
That is not always the case however, as real GDP is not evenly distributed, so whilst overall GDP and average GDP may rise, some individuals may not be better off, or may even experience a fall in their income.
To better assess changes in living standards, we must consider changes in the types of product produced and the ways that they are produced. Output often rises during wartime, as many weapons are being produced, but this does not mean that people’s quality of lives are improving.
In general, more consumer goods and services, such as housing, food, transport and clothing, typically raise people’s living standards. Shifting resources from production of consumer goods to production of capital goods allows more consumer goods to be produced and enjoyed, but only in the future; fewer consumer goods will be able to be produced at the present time (assuming that in the short run the economy is operating at the frontier of its production possibility curve. Below is demonstrated this reduction in consumer goods produced in the short run and increase in the long run:

Also, access to more consumer goods and services does not always make people happier. Accessing more and higher-quality product can lead to an increased desire for even more and even better products. e.g. A person buying their first car is often happy at first, but then within a short space of time they want a better model.
Real GDP measures quantity of output produced, but does not consider quality. In practice however, quality of output tends to rise over time. Working conditions also tend to improve over time and working hours usually fall. If real GDP per head stays constant one year, but working conditions rise and/or working hours fall, then people’s living standards will rise. A decline in environmental conditions will lower living standards, but not necessarily real GDP.
Task – Distribution of Economic Growth
Comparing GDP per head between countries
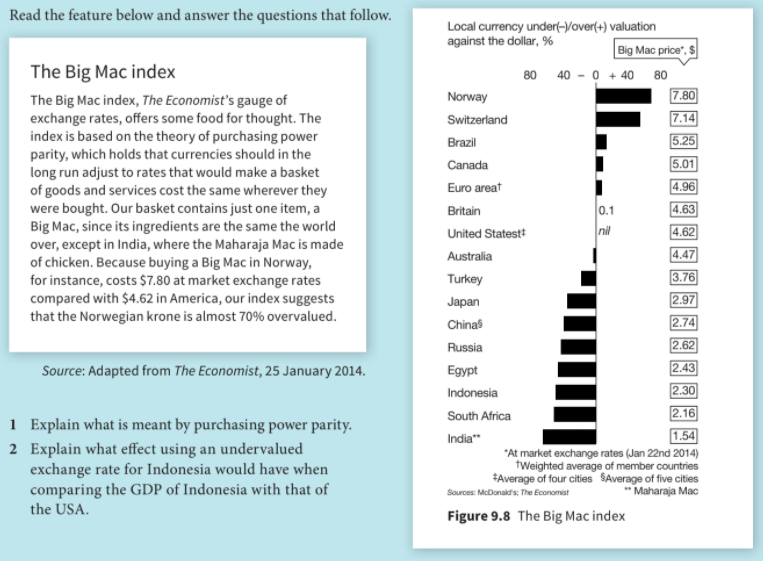
To compare living standards between countries, we need to convert the real GDP per capita into a common currency. In order that changes in exchange rates should not distort the comparison, economists typically adjust exchange rates to reflect their purchasing power parities (PPPs).
Even if a country has a higher real GDP per head than another country using PPPs, it inhabitants may not be enjoying higher living standards. Kuwait has one of the highest real GDPs per head in the world, but has some immigrant workers on extremely low wages.
To compare living standards between countries, factors must be considered that are not included in real GDP per head, such as working hours, working conditions, fear of crime and freedom of thought.
Task – The Super Rich

Task – Big Mac Index
National Debt
Government, or public sector debt, is the total debt which the government has built up over time. It is expressed as a percentage of GDP. A budget deficit in a year will add to the country’s national debt and a budget surplus can be used to reduce it. National debt typically increases during economic downturns, when government expenditure normally rises at a faster rate than tax income, compounded by a tendency to increase government spending to tackle the downturn. Military conflicts also often lead to significant increases in national debt.
Having a large and increasing national debt has several disadvantages. Interest payments on the national debt represent an opportunity cost as the government revenue use to service them could be used to finance, for instance, the building of new schools. A high level of debt may make lenders reluctant to lend to the government, thus pushing up the rate of interest that must be paid.
Note that national debt and external debt are not the same thing, as some of the national debt will be owed to citizens of the country (e.g. that have bought government bonds).
Other indicators of living standards and economic development
Some indicators related to living standards can be measured in money terms, e.g. education spending as a percentage of GDP, whereas some are measured in non-monetary terms, e.g. infant mortality rates and number of doctors per 10,000 people.
Some composited measures have been developed, for instance:
- Measurable Economic Welfare “MEW”: Developed in 1972 in the US as an attempt to give a more complete picture of living standards by adjusting GDP figures upwards for factors that improve living standards, such as increased leisure time, and downwards for factors that reduce living standards. It is, of course, difficult and expensive to measure the value of non-marketed goods and services;
- Human Development Index “HDI”: Developed by the UN, this considers GNI per head, education (i.e. mean and expected years of schooling) and health care. A country’s HDI value shows how far the are from the maximum value of 1. Countries are classified as high, medium and low human development. Notably in 2012, Cuba’s HDI ranking was considerably higher than their GNI per head ranking, whereas Qatar’s was significantly lower. The table below shows the countries with the highest and lowest HDI rankings:
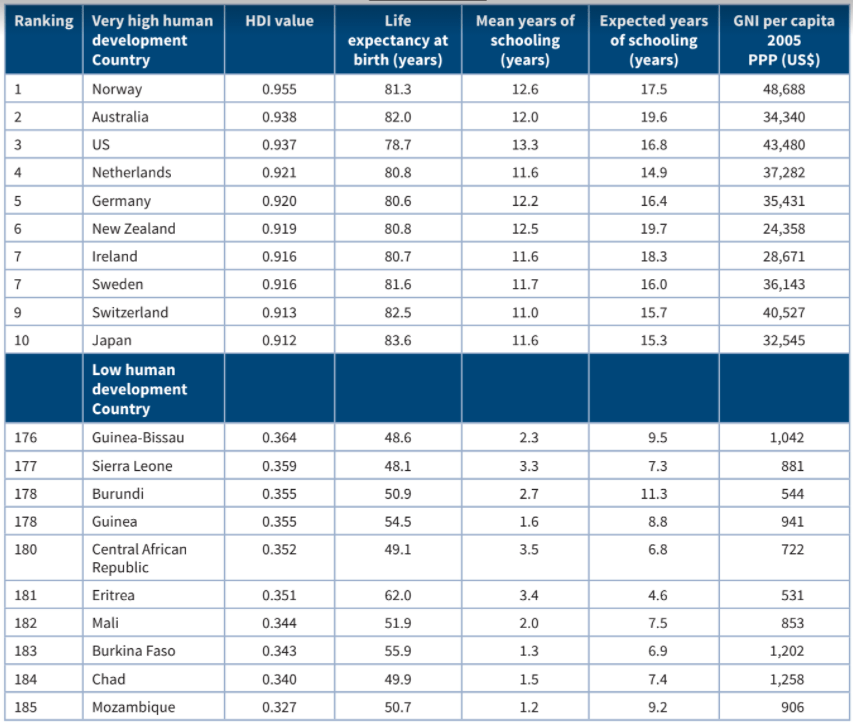
Task – HDI

- Multidimensional Poverty Index (MPI) was developed in Oxford (in coordination with the UN) in 2010 and measures indicators of living standards (e.g. food, fuel, drinking water, floor space), education (years of school and attendance) and health (child mortality and nourishment), with a third of the weighting being given to each of these categories. A household is considered to be multidimensionally poor if they are deprived in at least 33% of the weighted indicators.
Kuznets Curve

This curve suggests that as an economy develops, income becomes more unevenly distributed until after a certain income level, when it becomes more evenly distributed. This trend is not being followed in all developing economies however, and does not explain the rise in income inequality in some developed economies such as the UK.
