Rational Functions
If a function can be defined as a fraction with polynomials on the numerator and the denominator, we can call it a rational function.
We are going to be interested in representing rational functions on the Cartesian plane.
Asymptotes
On a graph, we use dotted lines to denote asymptotes. These are lines that a curve approaches but does not end up touching. We say that a curve converges towards the asymptotes.
In addition to curve-drawing techniques that we have previously used, such as identifying where a curve intersects coordinate axes, and identifying stationary points, we can also use the asymptotes help us to draw a curve.
To help understand the exact shape of a curve we can check points very close to the asymptotes. The asymptotes represent a discontinuity in a curve.
Drawing Graphs
Converting a rational function into partial fractions can be helpful when identifying its graph, also because it can make differentiation easier (e.g. to identify turning points).
We calculate the asymptotes along the x-axis by finding values for which the function is not defined, e.g. values for which the denominator equals zero. We calculate asymptotes along the y-axis by looking at what happens when x becomes very large or very small (i.e. –>∞ or –> -∞).
It is also often useful to divide the fraction through by the highest term, to form terms that tend to zero, so we can easily say what happens as the unknown becomes very large (or very small). (e.g. 

Stationary Points
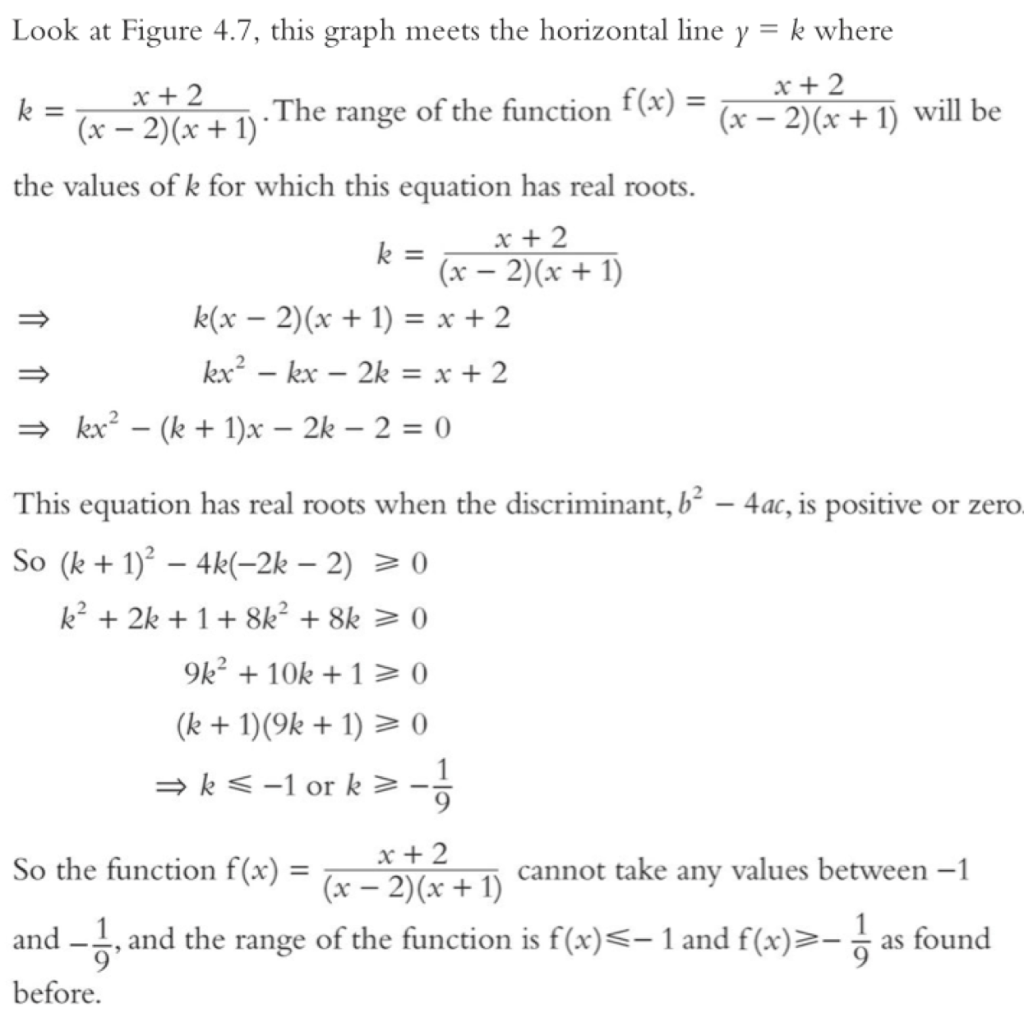
As an alternative to differentiating, stationary points can also be found by rearranging k = f(x) into a quadratic equation in x (treating the y’s as coefficients). The discriminant of this quadratic equation can then be inspected to identify which values of k make it equal to zero (i.e. because at stationary point curve meets horizontal line at one point instead of two).
Worked Example
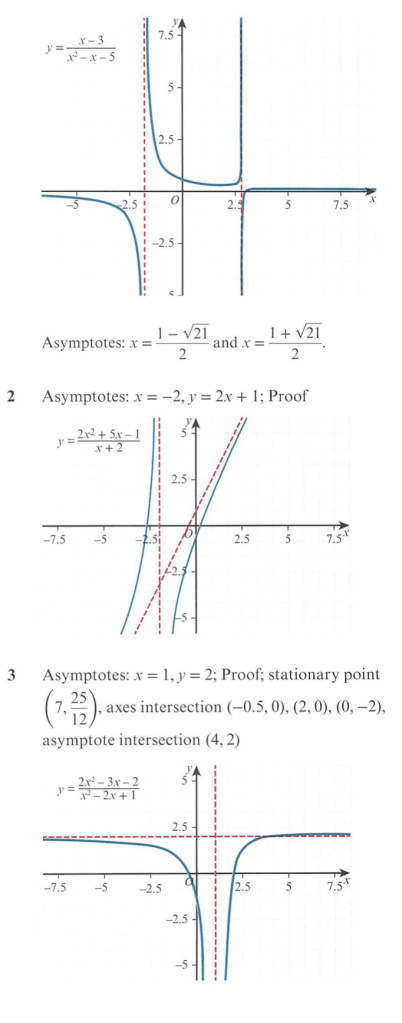
Sketch

Worked Solution
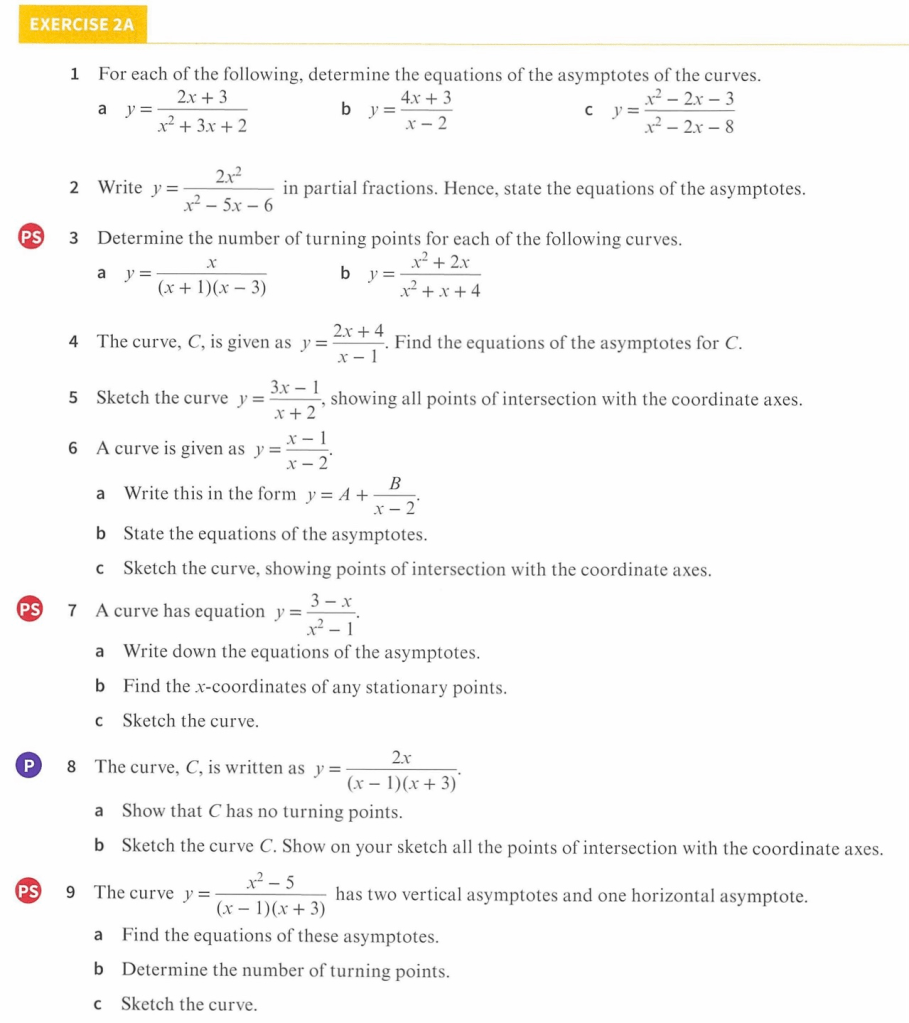
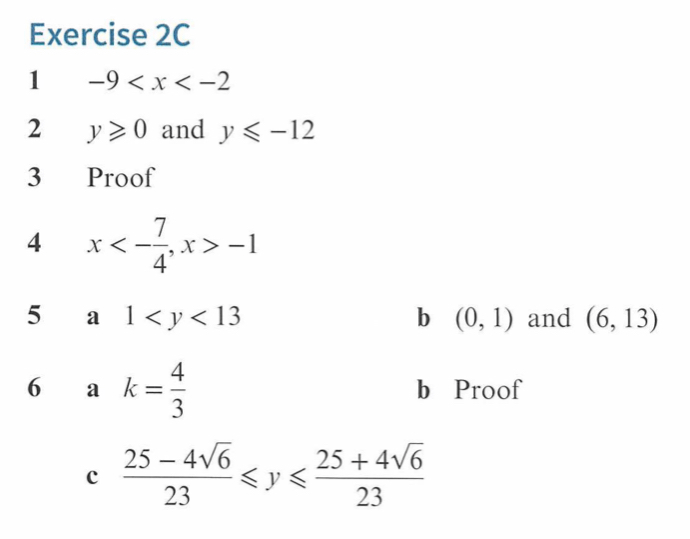
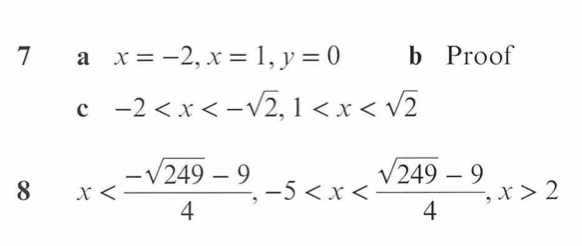
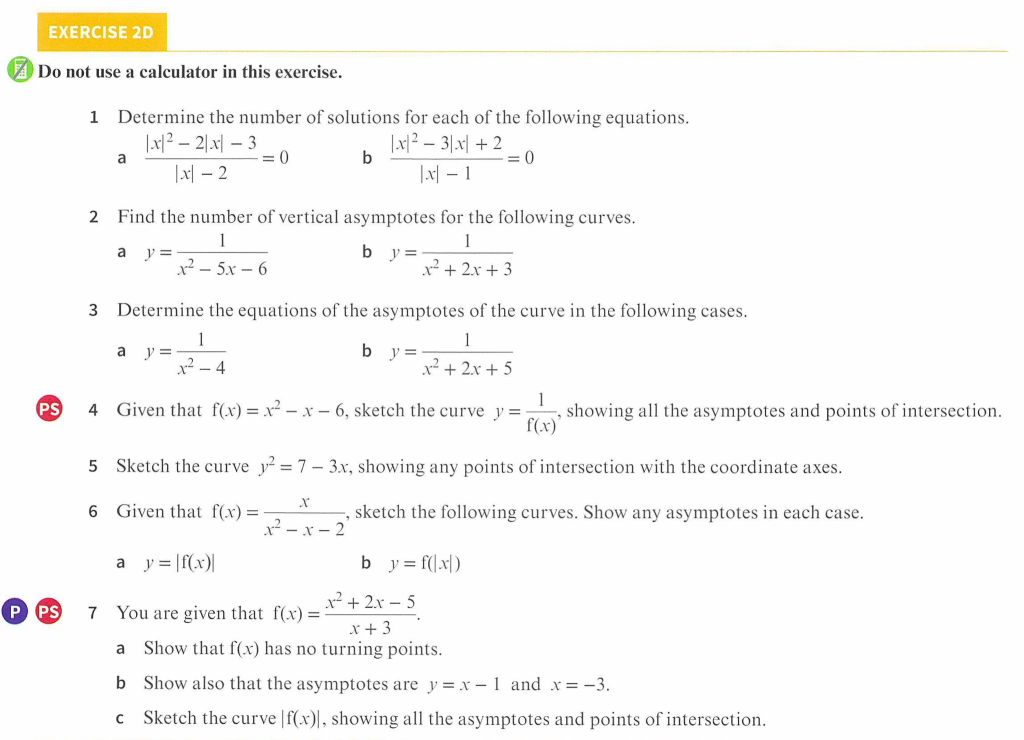
Exercise 1
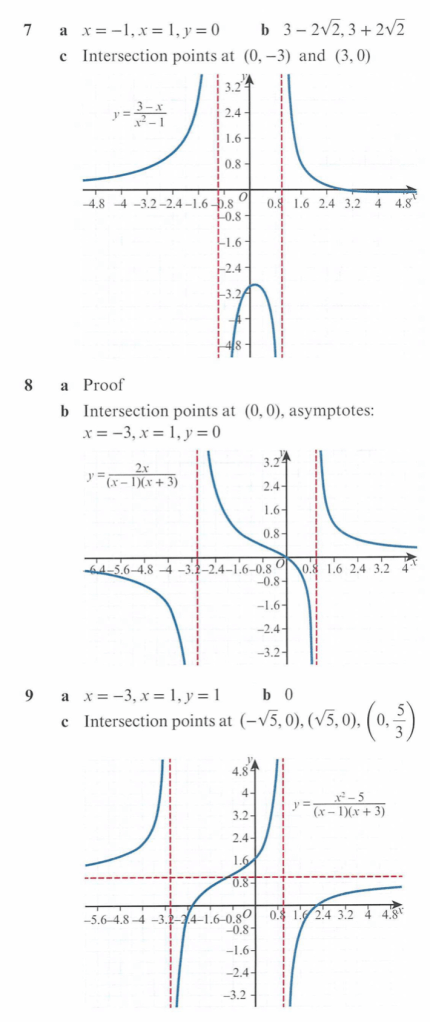
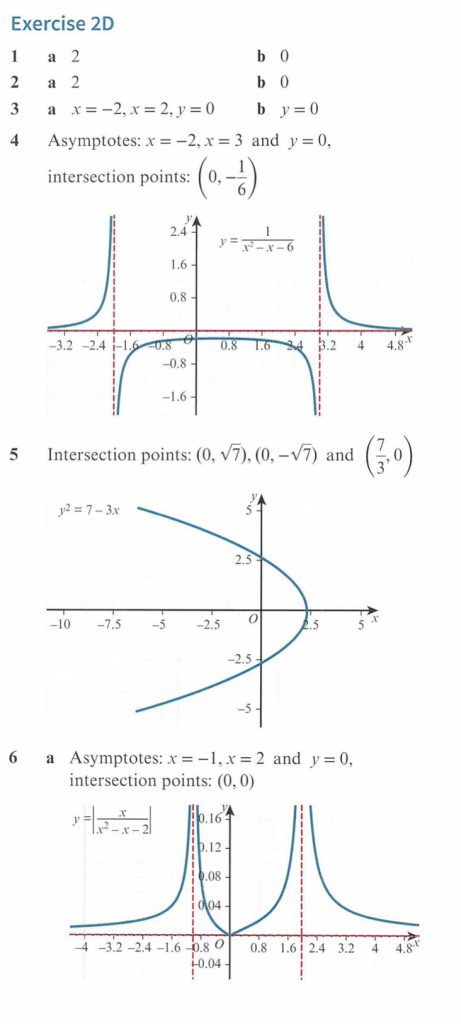
Exercise 1 Answers

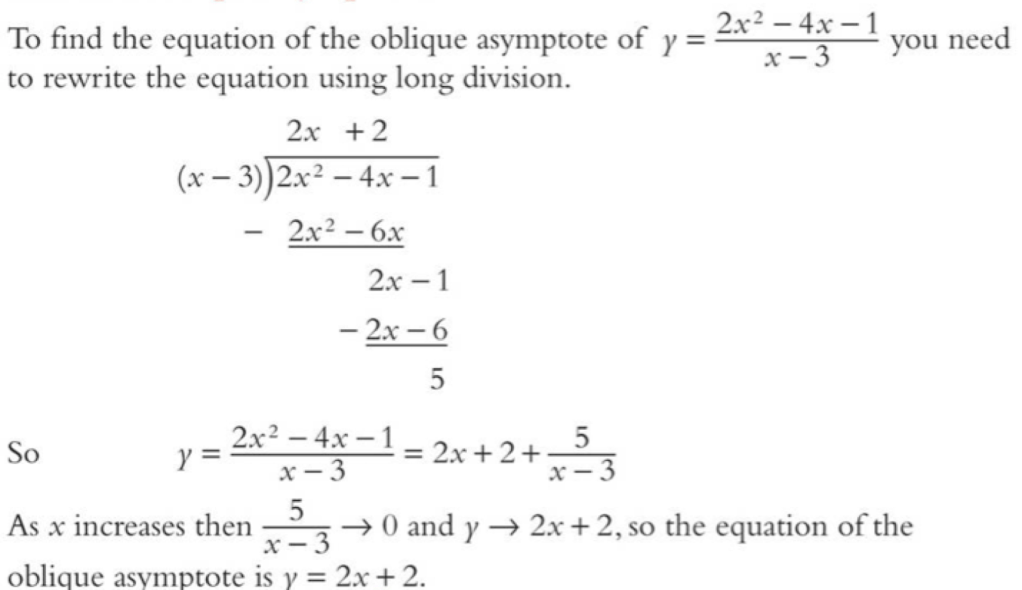
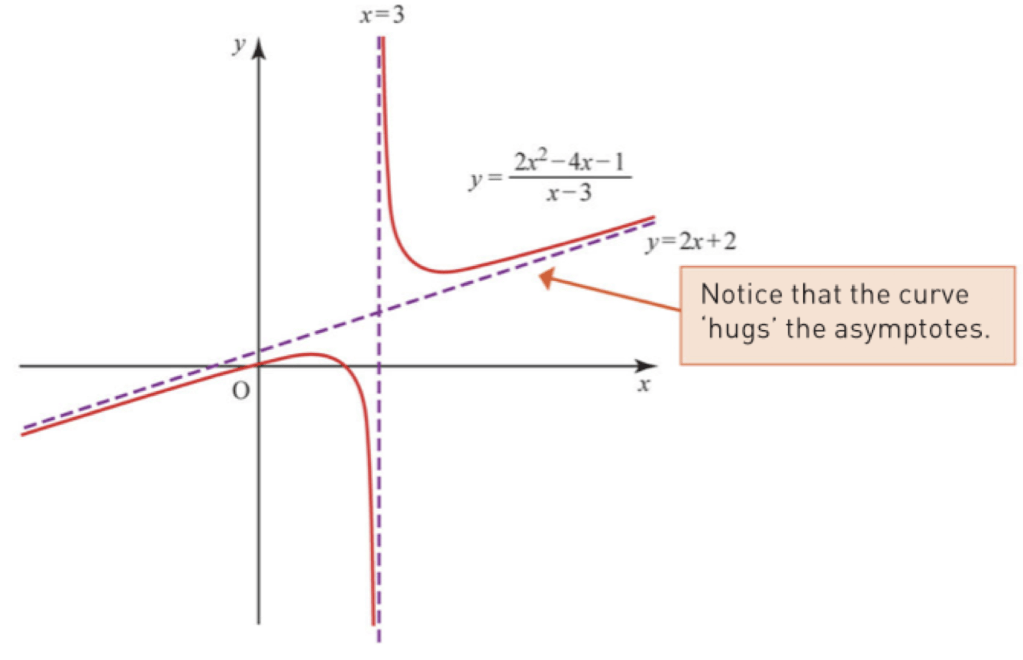
Oblique Asymptotes
In a rational function, if the degree of the numerator is one higher than the degree of the denominator, then there will be an oblique (i.e. diagonal) asymptote.
We can find the equation of the asymptote by rewriting the rational function as a partial fraction and then considering its behaviour as x→∞ or x→-∞.
As previously, it is useful to consider “nearby” values so we can identify the curve’s behaviour as it approaches asymptotes.
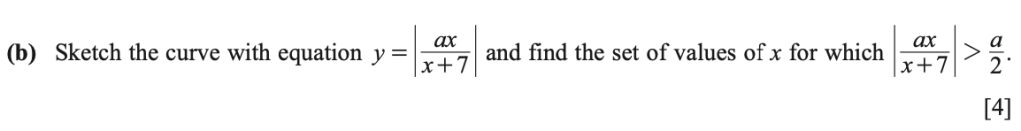
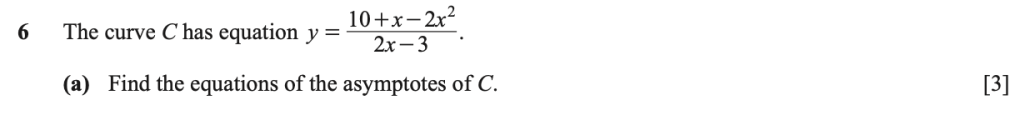
Worked Example
Sketch

Worked Solution
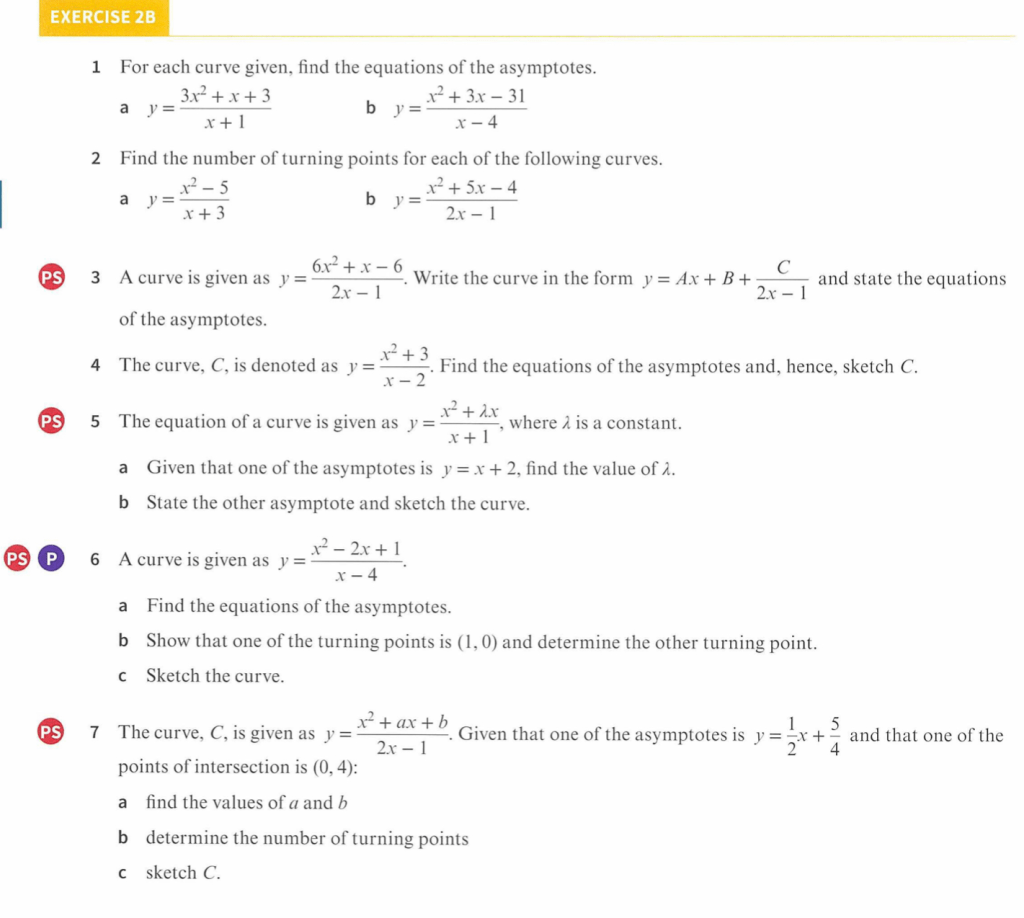
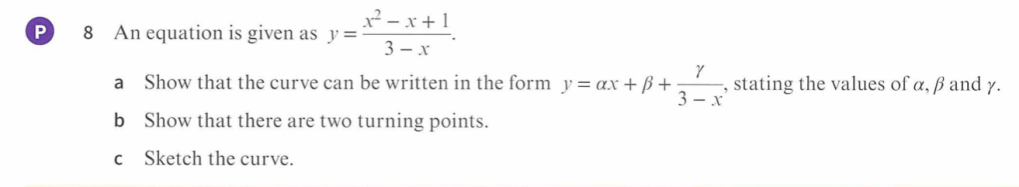
Exercise 2
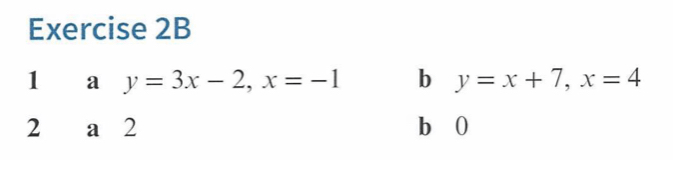
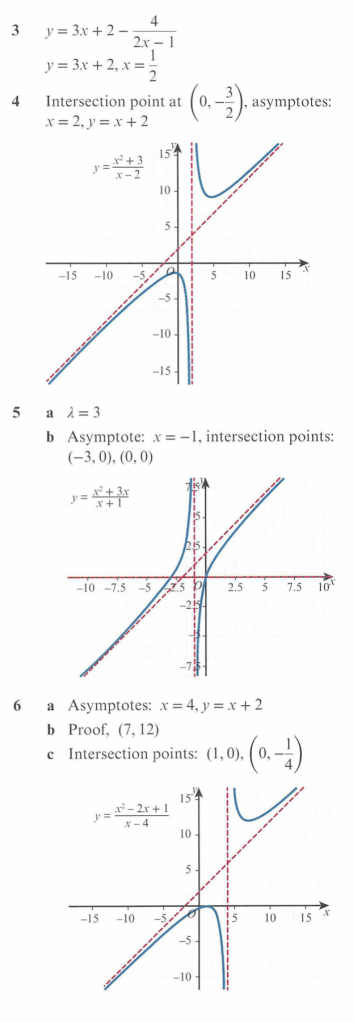
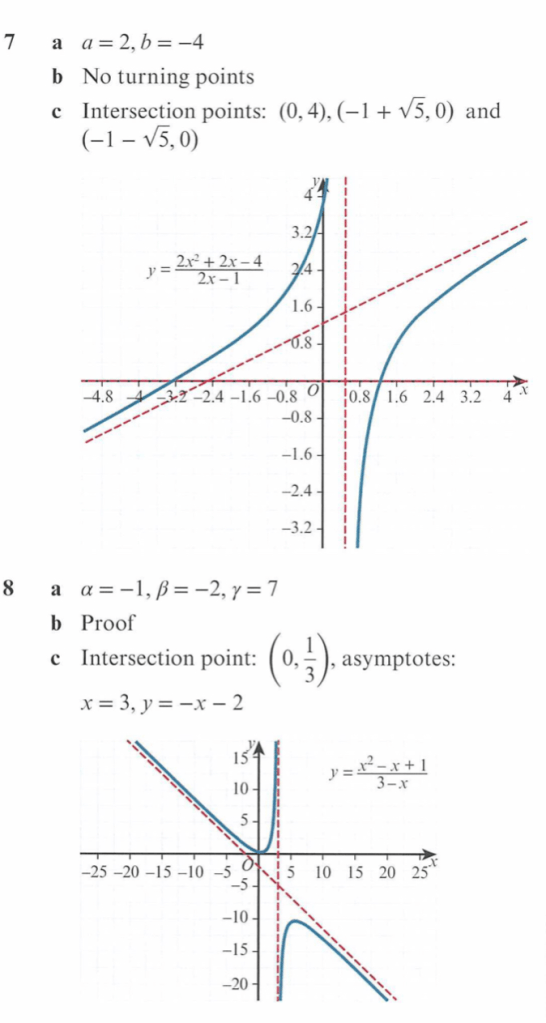
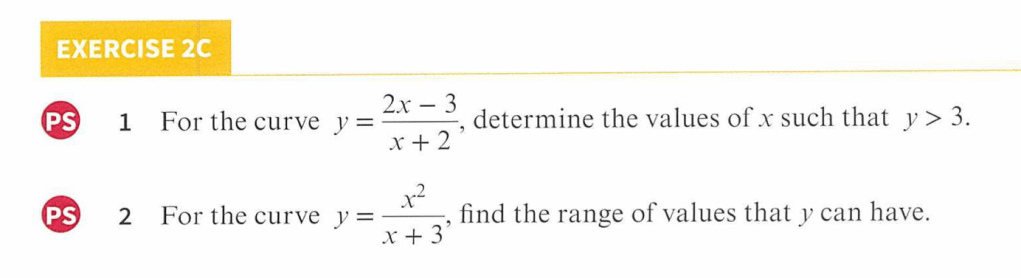
Answers to Exercise 2
Worked solutions to Exercise 2
Inequalities
We can use graphical methods to identify the solution set of an inequality.
Consider 
We can find the range of a function by identifying its turning points and considering the shape of the graph.
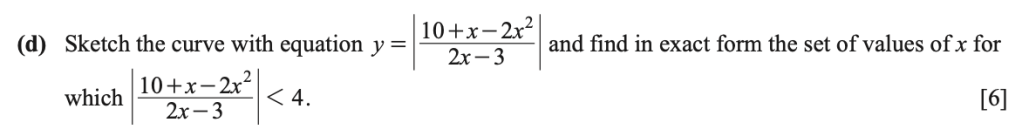
Worked Example
Solve these inequalities, by first sketching one or more appropriate curves:
1.)

2.)

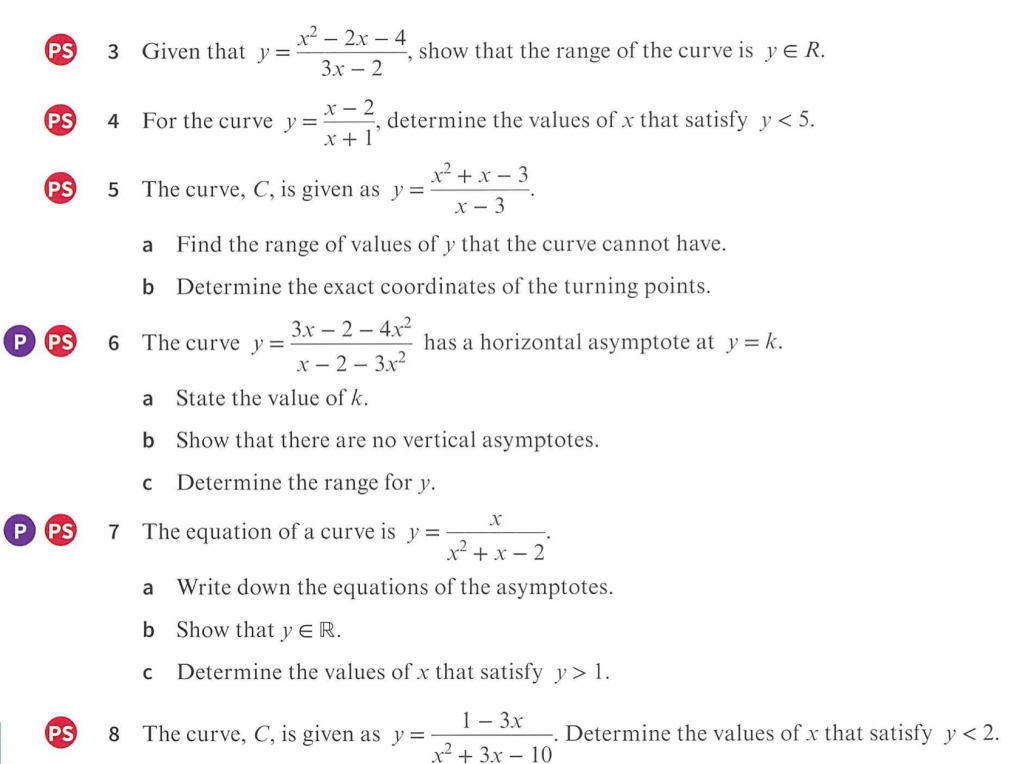
Exercise 3
Answers to Exercise 3
Worked Solutions to Exercise 3
Inferrring one curve from another
- If we know the curve y=f(x) we can determine
- the curve
, by:
- replacing x-intercepts with vertical asymptotes (and vice versa);
- reciprocating the y-coordinate of y-intercepts and horizontal asymptotes;
- noting that where y=f(x) is increasing, y=1/f(x) will be decreasing (and vice versa) (stationary points will be unchanged);
- the curve y2 = f(x) by sketching y = √f(x) and taking its reflection in the x-axis.
- the curve
Worked Example
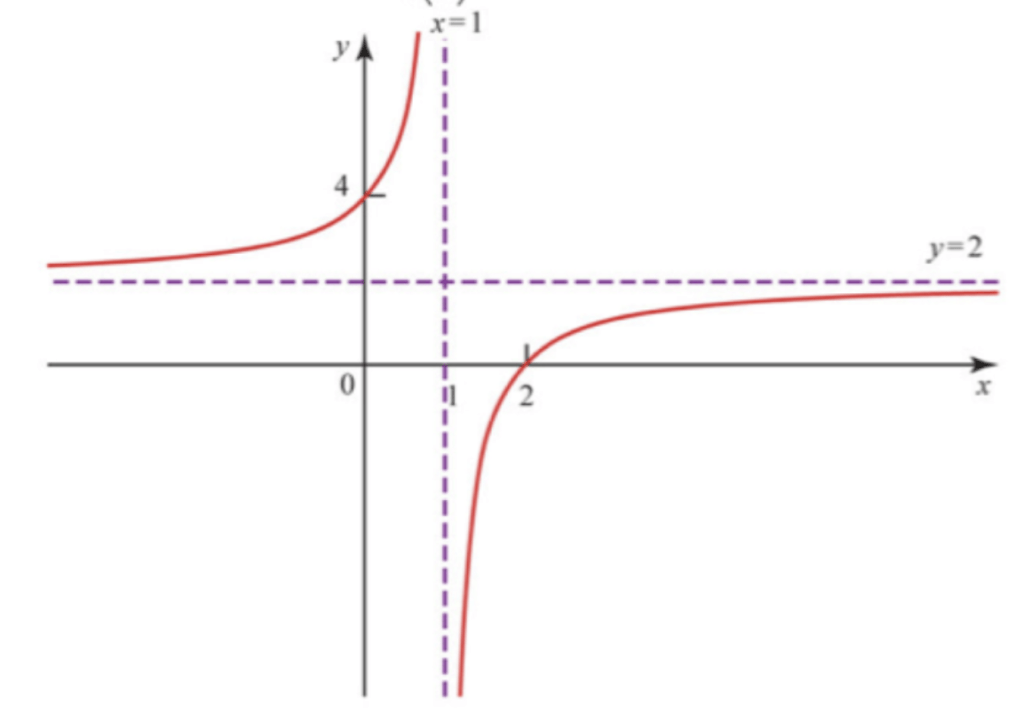
- The diagram below shows the curve y = f(x).
- The lines x=1 and y=2 are asymptotes to the curve and the curve intercepts the axes at (0,4) and (2,0)
- Sketch the curve

Example
- If we know the curve y=f(x) we can determine:
- the curve y = |f(x)|, by replacing all negative y-values with positive y-values with the same absolute value;
- the curve y = f(|x|), by keeping only the part of the curve for
and reflecting it in the y-axis.
Worked Example
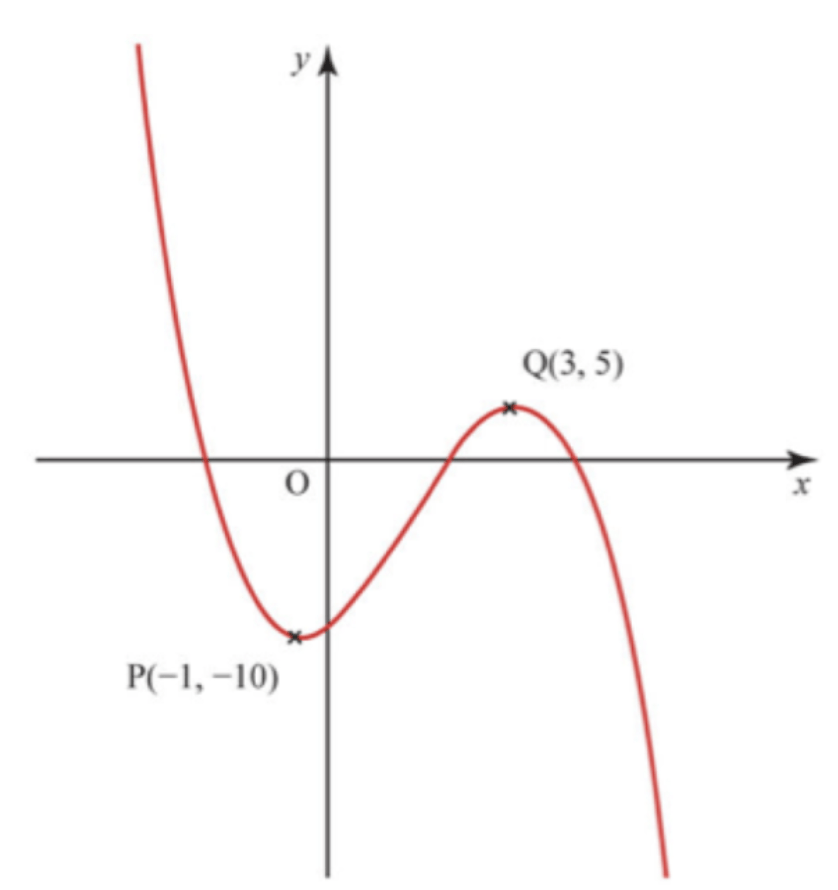
- The diagram below shows the curve y=f(x), which has stationary points at P and Q. Sketch the curves:
- y = |f(x)|
- y = f(|x|)
Exercise 4 & General Exercises
Answers to Exercise 4 and General Exercises
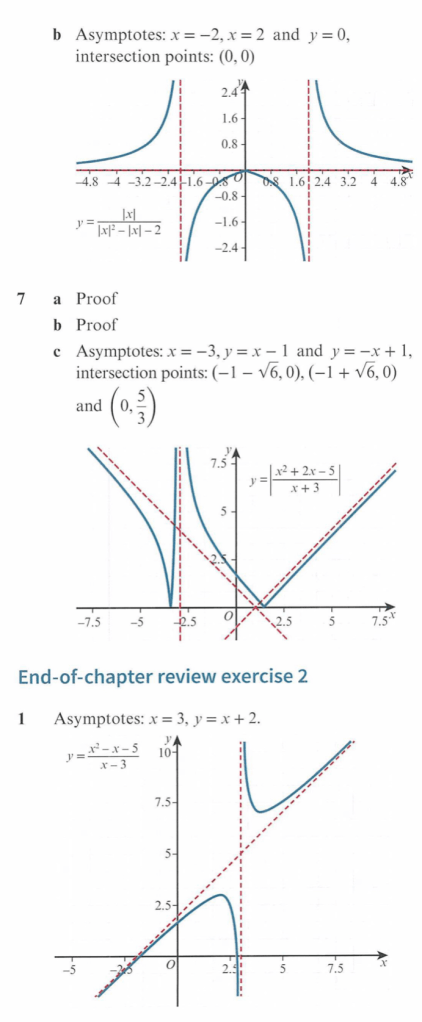
Worked Solutions to Exercise 4
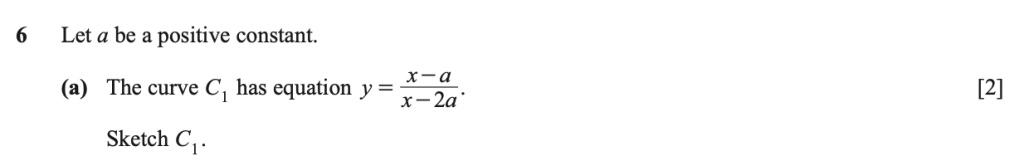
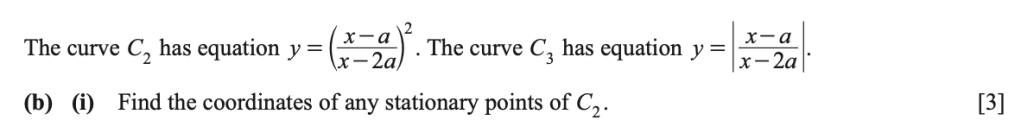
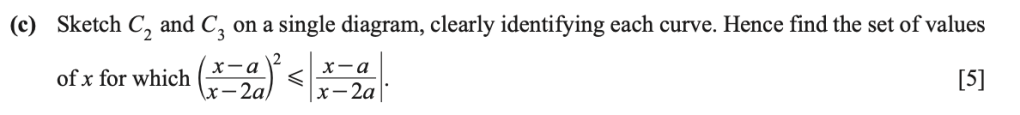
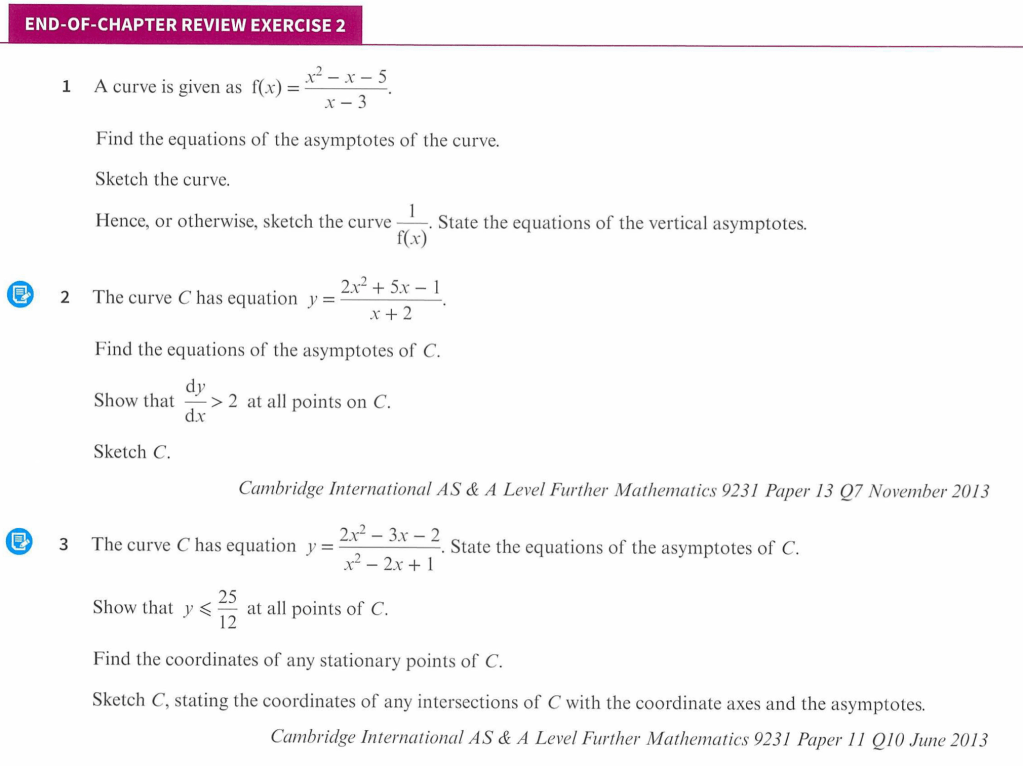
Past Paper Exam Questions
Summer 2020 11:

Summer 2020 13:


Winter 2020 11:


Winter 2020 12: